A breakdown of the Bonsai cluster dashboard’s Overview.
Last updated
June 16, 2023
The Bonsai cluster dashboard’s Overview provides a series of useful metrics about your cluster.
This article will cover the following:
Cluster Information
Performance metric
Traffic Summary
Usage
Data Allocation
Tenants
How to find help
Cluster Information
Overview provides general information about your cluster at the top:
The account name, cluster’s name, and health status dot (which will be green, yellow or red) is found here. Below that, the region the cluster is provisioned in, the version of Elasticsearch it’s running, and the subscription plan tier is display.
Performance
The first component is the Performance heatmap:
This heatmap reveals how fast requests are. Each column represents a “slice” of time. Each row, or “bucket”, in the slice represents duration speed. The"hotter" a bucket is colored, the more requests there are in that bucket. To further help visualize the difference in the quantity of requests for each bucket, every slice of time can be viewed as a histogram on hover.
You can check out our Metrics documentation for a more detailed dive into cluster metrics.
Traffic Summary
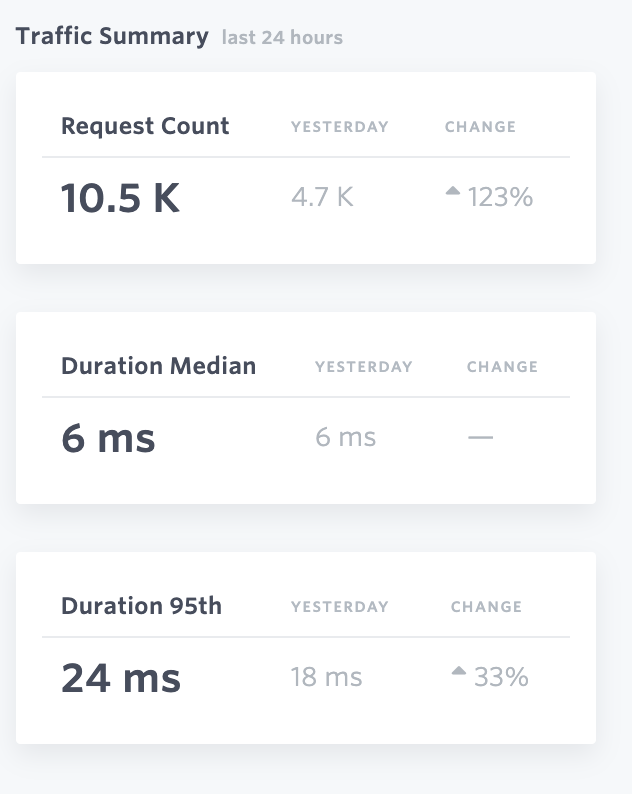
Traffic Summary highlights several statistics in the last 24 hours:
Request Count: This is the total number of requests your cluster has served in the past 24 hours. If there is a ‘-’ (hyphen character), then there is no data available to report. Also indicated are request counts for the previous 24 hours under Yesterday, and the percentage change between the two days.
Duration Median: This indicates your median request latency. The first number is the median response time for all requests over the past 24 hours. Also indicated are the median request latency for the previous 24 hours under Yesterday, and the percentage change between the two days. The median is an important metric because it’s more resistant to long tail effects and gives a better picture of overall performance than averages.
Duration 95th: This shows the 95th percentile in response times. The previous 24 hour period is found under Yesterday, and the percentage change between the two days. A percentile indicates how much of the data set falls below a particular value. For example, if the p95 response time for a cluster is 100ms, that means 95% of all requests are occurring in 100ms or less. This is an important metric for benchmarking, especially with high traffic volumes.
Usage
This component shows the cluster’s current usage versus the limits of your plan for 3 items:
Docs: This is the total number of documents you have in your cluster. We’re counting all documents, which can sometimes lead to confusion when nested documents are involved. If you have a parent document with three child documents, that counts as four documents - not one. This can be a source of confusion, as Elasticsearch may report different counts based on the endpoint queried.
Data: This is the disk footprint of your cluster, or the amount of data your cluster is occupying on the server.
Shards: This is the number of shards in your cluster across all indices. We’re counting both primary and replica shards here.
Data Allocation
This component indicates how your data is allocated across your cluster. If the allocation seems radically unbalanced, that can be an indication that you should reindex your data with an updated shard scheme. Documentation on this can be found in our Capacity Planning documentation.
Business / Enterprise Plans
If you upgrade to a Business / Enterprise cluster, you may see some extra nodes appear here, and may further observe that these nodes have few or 0 shards allocated. This is expected. These extra nodes will be cleaned up and removed later.
Tenants
Enterprise subscriptions support private multitenancy. For clusters running on these subscriptions, there will also be a Tenants table that lists tenants on the cluster: